Parallel Disease Transmission Simulation

Summary
We are going to implement a parallel disease transmission simulation system on both GPU and multi-core CPU platforms. Each person is represented by a node on a 2d plane and is in the state of susceptible, infectious, recovered and dead. We will use different parallel techniques and compare their performance improvements.
Background
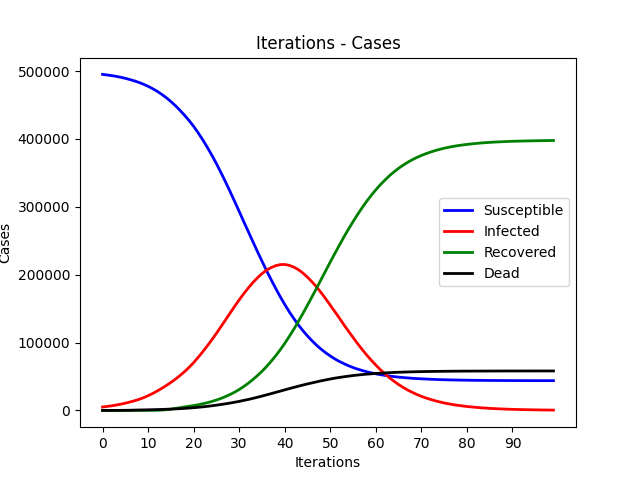
The SIR Model is an epidemiological model that computes the theoretical number of people infected with a contagious illness in a closed population over time. It has been applied to a variety of disease simulations. S, I and R represent susceptible, infectious and recovered.
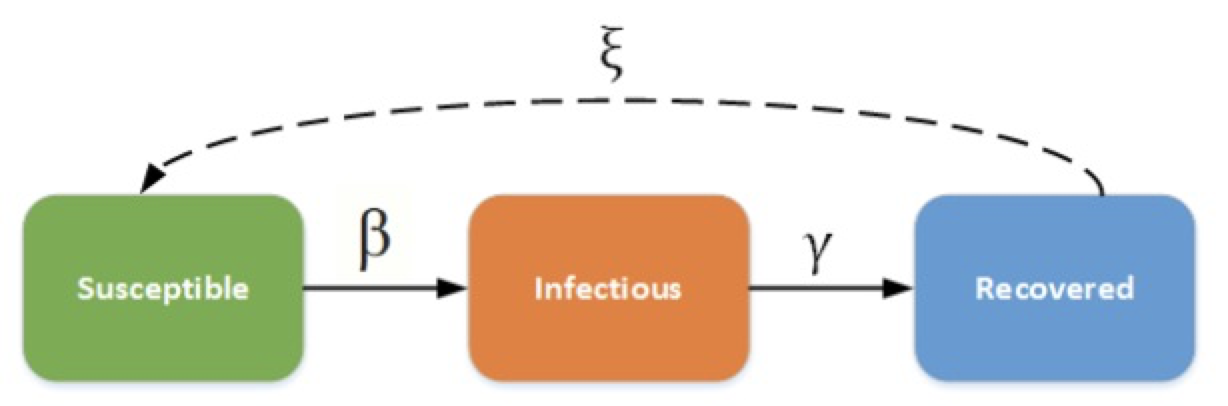 Figure 1[https://docs.idmod.org/projects/emod-generic/en/latest/model-sir.html]
This model can have a great simulation result while it also contains a large amount of calculation. A sequential version are as follows:
for each iteration:
    for node in allNodes:
        neighbours = []
        for othernode in allNodes:
            if distance(node, othernode) < scope_of_infection:
                neighbours.add(othernode)
        probability_of_infection = combine_probability(neighbours);
        update_node_states(node, probability_of_infection);
    move(allNodes)
Challenges
Some difficulties in the parallel solution:
- Regarding the dependencies. We have a lot of dependencies in this problem. E.g. the probability of getting affected for a single node is dependent on its neighbor nodes. Also, depending on how we assign tasks, we may need to send information alone the boundaries to other instances (like ghost rows in the WAVE example).
- Regarding the communication to computation ratio. After each iteration, all instances(threads) may need to synchronize with each other to update the information they have. So the communication overhead might become an issue.
- Regarding the locality. For each instance(thread), depending on how we assign tasks, there might be temporal locality where the computation of a same node will be assigned to the same instance for consecutive iterations.
- Based on the state of a node (healthy, dead, infected, healed), there are different divergent executions.
- Regarding constraints that make it hard to parallel. Like the N-body simulation problem, since nodes are moving around in each iteration, the load balancing will become an issue if we simply use the static assignment. Thus sophisticated assignments (e.g. dynamic assignment, semi-static assignment) may be needed for good load balancing.
Resources
Papers
[1] Huang C Y, Tsai Y S, Wen T H. Simulations for epidemiology and public health education[M]//Operational Research for Emergency Planning in Healthcare: Volume 2. Palgrave Macmillan, London, 2016: 176-202.
[2] Focks D A, Daniels E, Haile D G, et al. A simulation model of the epidemiology of urban dengue fever: literature analysis, model development, preliminary validation, and samples of simulation results[J]. The American journal of tropical medicine and hygiene, 1995, 53(5): 489-506.
[3] Currie C S M, Fowler J W, Kotiadis K, et al. How simulation modelling can help reduce the impact of COVID-19[J]. Journal of Simulation, 2020: 1-15.
[4] Thompson, R.N. Epidemiological models are important tools for guiding COVID-19 interventions. BMC Med 18, 152 (2020). https://doi.org/10.1186/s12916-020-01628-4
[5] Kephart J O, White S R. Directed-graph epidemiological models of computer viruses[M]//Computation: the micro and the macro view. 1992: 71-102.
[6] Hethcote H W. Three basic epidemiological models[M]//Applied mathematical ecology. Springer, Berlin, Heidelberg, 1989: 119-144.
Machine
- Bridge Cluster
-
CPU: Intel(R) Xeon(R) CPU E5-2695 v3 @ 2.30GHz
-
GPU: NVIDIA P100 GPU, 16GB of GPU memory (32GB/node)
-
- Latedays Cluster
- CPU: Two, six-core Intel(R) Xeon(R) CPU E5-2620 v3 processors, 2.4 GHz, 15MB L3 cache, hyper-threading, AVX2 instruction support
- GPU: A NVIDIA K40 GPU (4.3 TFLOPS), 12 GB RAM (288 GB/sec memory bandwidth)
Goals and Deliverables
Deliverables of this project:
- [Base Delivery] Implement a sequential version of this problem and record its performance as the baseline. (Completed)
- [Base Delivery] Achieve speed up on CPU machines. Different parallel models will be used to evaluate the speed up, including shared-memory model and message-passing model. (Completed Shared-memory, working on MPI)
- [Base Delivery] Achieve speed up on GPU machines using CUDA. (TODO)
- [Base Delivery] After completion of the previous goals, we will include a detailed comparison of different approaches and analyze the performance differences. (TODO)
- [Base Delivery] Performance graph of different methods to indicate that our parallel versions indeed have significant speedup compared with the sequential version. (TODO)
- [Stretch] Try different task assignment methods to see if we can achieve better performance. (TODO)
- [Stretch] Visualization of the disease transition for each iteration. (TODO)
Platform Choice
Platform
We prefer running the CPU code on Bridge Machines since we found they are more stable than the Latedays Machines. If GPU resources is available on Bridge Machines, we will also run the GPU solution on the Bridge. But if not, we will choose Latedays Machines.
Language
C/C++, CUDA
Schedule
- 11.11 Complete the sequential version
- 11.18 Complete shared-memory on multi-core CPU,
- 11.25 Complete message passing model on multi-core CPU
- 11.30 Implement the GPU version.
- 12.5 Compare the difference between approaches, complete the final report and poster.
- [Stretch goal] if we have time, we will also try different task assignments and see if we can achieve better results.
Updated schedule:
- (11.30 - 12.3) Finish the share memory model(openmp) and message passing model(mpi).
- (12.4 - 12.6) Design and implement the CUDA version, analyze the performance for shared memory and message passing model, generate graphs on different processors and compare the performance, analyze the reasons for speedup and bottlenecks.
- (12.7 - 12.10) Complete CUDA version, comparing the performance with shared memory and message passing model
- (12.11 - 12.13) Visualize the simulation process (Nice to have), finish the report, and prepare for the poster session.
Documents
Midterm Report: here.
Final Report: here
Final Demo Slides: here